Visualizing our queries

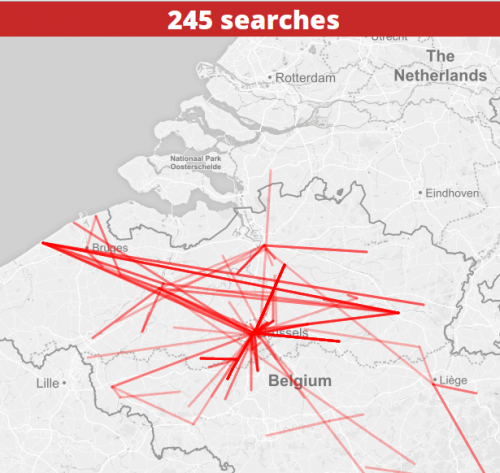
On top of the iRail API, many requests happen. Even if we give concrete numbers, it remains difficult to understand how many requests we actually get. Serkan Yildiz, one of the open Summer of code students, created the open iRail map, that visualizes requests in real time. Check it out:

Screenshot from 2016-07-19 14-37-15

About Pieter Colpaert

Pieter is a researcher in linked transport data publishing at MMLab - UGent - iMinds. He also co-founded Open Knowledge Belgium, in which he represents the iRail/Open Transport Working Group.

19. July 2016 by Pieter Colpaert
Categories: Uncategorized | Leave a comment

Leave a Reply

Required fields are marked *